ggiraph, plotly
State of the R
24-28/08/2020
Un premier exemple: nuages de points
library(palmerpenguins)
library(tidyverse)
library(ggiraph)
library(cowplot)
theme_set(theme_minimal())On va travailler avec le jeu de données des pingouins de Palmer.
penguins## # A tibble: 344 x 8
## species island bill_length_mm bill_depth_mm flipper_length_… body_mass_g
## <fct> <fct> <dbl> <dbl> <int> <int>
## 1 Adelie Torge… 39.1 18.7 181 3750
## 2 Adelie Torge… 39.5 17.4 186 3800
## 3 Adelie Torge… 40.3 18 195 3250
## 4 Adelie Torge… NA NA NA NA
## 5 Adelie Torge… 36.7 19.3 193 3450
## 6 Adelie Torge… 39.3 20.6 190 3650
## 7 Adelie Torge… 38.9 17.8 181 3625
## 8 Adelie Torge… 39.2 19.6 195 4675
## 9 Adelie Torge… 34.1 18.1 193 3475
## 10 Adelie Torge… 42 20.2 190 4250
## # … with 334 more rows, and 2 more variables: sex <fct>, year <int>ggplot(penguins) +
aes(x = bill_length_mm, y = bill_depth_mm, color = species) +
geom_point() +
scale_color_viridis_d()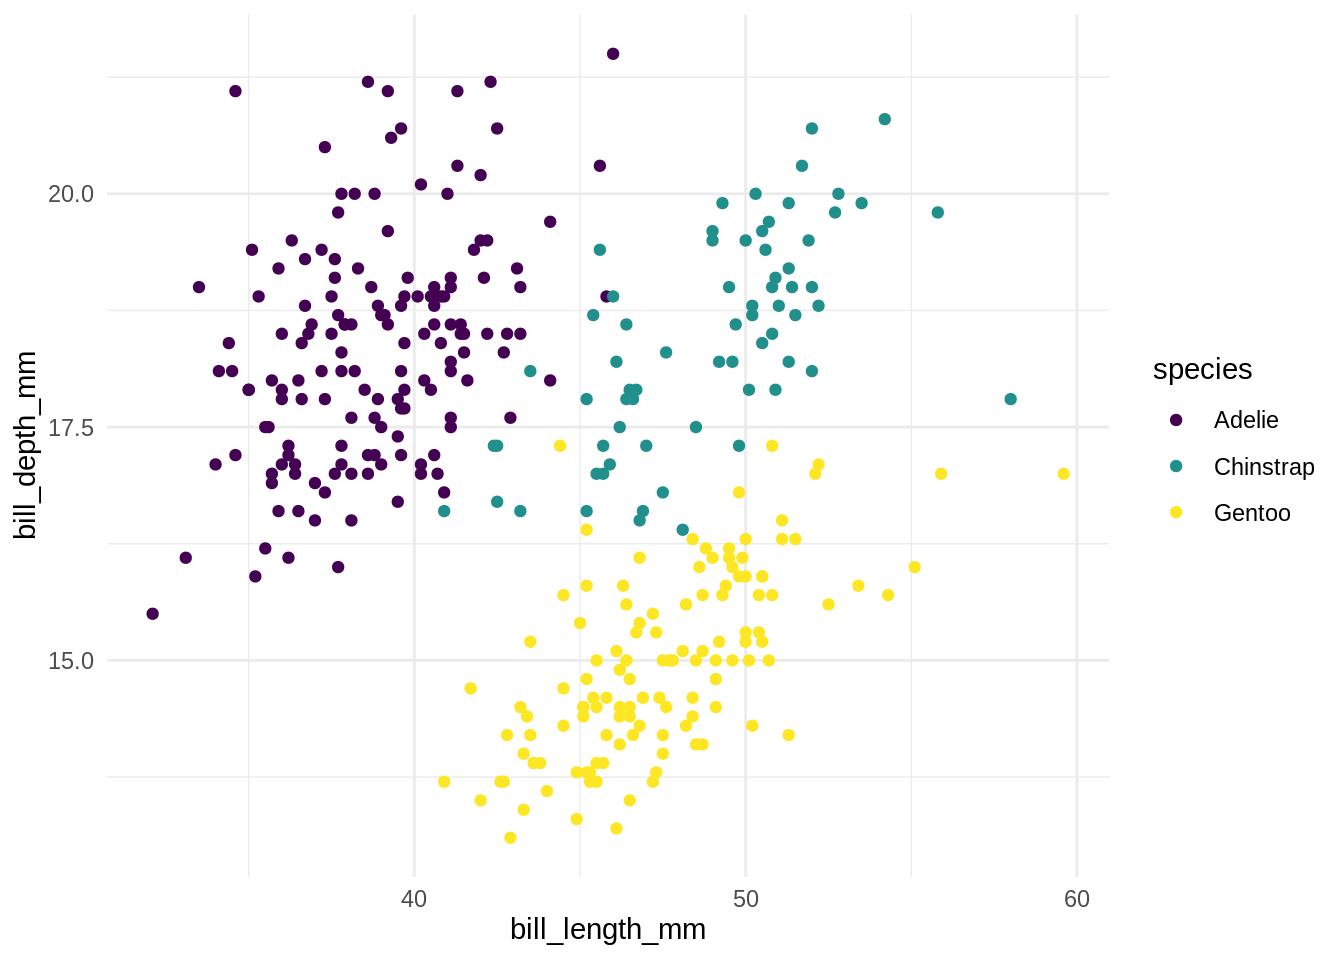
Nous allons animer le graphe précédent pour que lorsqu’on passe la souris sur le point, un texte indiquant l’île s’affiche et tous les pinguoins de la même île se mettent à briller.
p <-
ggplot(penguins) +
aes(x = bill_length_mm, y = bill_depth_mm, color = species) +
geom_point_interactive(aes(tooltip = str_c("Island: ", island), data_id = island)) +
scale_color_viridis_d()
girafe(ggobj = p)Nous allons dessiner deux nuages de points (donc quatre axes plus la couleur), et lorsqu’on passe sur un point dans un des deux nuages, sa représentation dans l’autre graphe se mette à briller.
penguins <- rowid_to_column(penguins)
p1 <-
ggplot(penguins) +
aes(x = bill_length_mm, y = bill_depth_mm, color = species) +
geom_point_interactive(aes(tooltip = str_c("Island: ", island), data_id = rowid)) +
scale_color_viridis_d() +
theme(legend.position = "none")
p2 <-
ggplot(penguins) +
aes(x = flipper_length_mm, y = body_mass_g , color = species) +
geom_point_interactive(aes(tooltip = str_c("Island: ", island), data_id = rowid)) +
scale_color_viridis_d() +
theme(legend.position = "none")
girafe(ggobj = plot_grid(p1, p2))Un deuxième exemple: “volcano plot”
Our goal is to add some interactivity to a “volcano plot”:
- clicking on a gene opens the GeneCards page
- hovering on a gene shows other genes from the same pathway
- …
Data
Microarray data from a differential gene expression study (Chiaretti et al 2005)
diff_exp <- readRDS("data/diff_exp.rds")
head(diff_exp)## meanDiff logp geneName
## 1 0.04345433 0.40724701 RABGGTA
## 2 0.04296986 0.34083644 MAPK3
## 3 0.03208350 0.18462685 TIE1
## 4 -0.01270016 0.08054529 CXCR5
## 5 -0.03177045 0.22418568 CXCR5
## 6 -0.42730253 1.08598298 DUSP1Using plotly
Setup:
library("plotly")
library("htmlwidgets")p <- plot_ly(data = diff_exp, x = ~meanDiff, y = ~logp) %>%
add_markers(
text = diff_exp[["geneName"]],
customdata = paste0("https://www.genecards.org/cgi-bin/carddisp.pl?gene=", diff_exp[["geneName"]]))
onRender(
p, "
function(el) {
el.on('plotly_click', function(d) {
var url = d.points[0].customdata;
window.open(url);
});
}
")Using ggiraph
library("ggplot2")
library("ggiraph")diff_exp$onclick <- sprintf("window.open(\"%s%s\")",
"https://www.genecards.org/cgi-bin/carddisp.pl?gene=", diff_exp[["geneName"]])p <- ggplot(diff_exp,
aes(meanDiff, logp)) +
geom_point()
p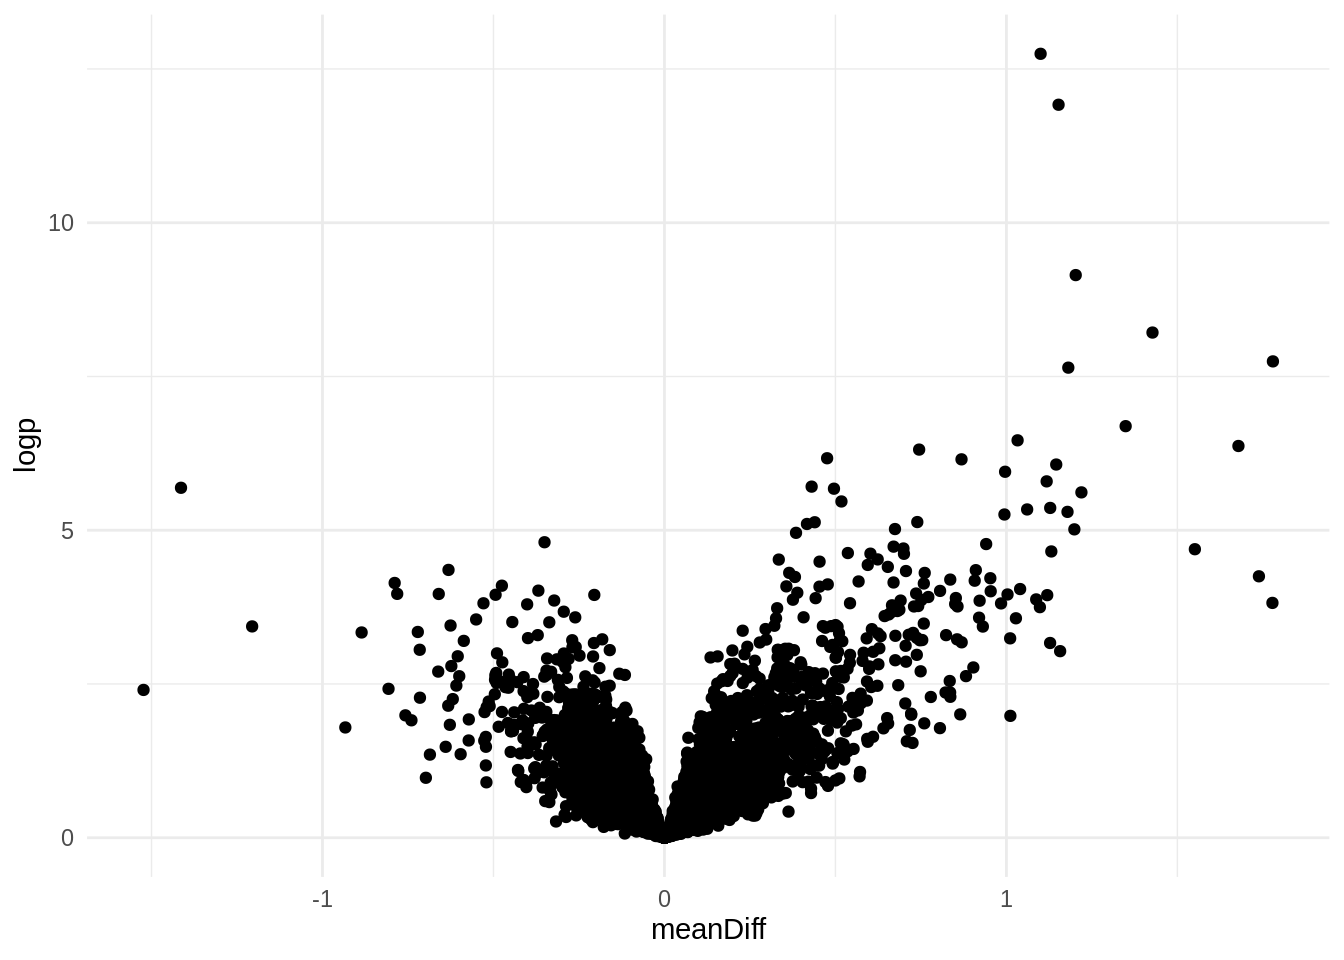
ip <- p + geom_point_interactive(
aes(data_id = geneName,
tooltip = geneName,
onclick = onclick))
girafe(ggobj = ip)Session information
sessionInfo()## R version 3.6.3 (2020-02-29)
## Platform: x86_64-conda_cos6-linux-gnu (64-bit)
## Running under: Ubuntu 18.04.5 LTS
##
## Matrix products: default
## BLAS/LAPACK: /usr/share/miniconda/envs/finistR2020/lib/libopenblasp-r0.3.10.so
##
## locale:
## [1] LC_CTYPE=C.UTF-8 LC_NUMERIC=C
## [3] LC_TIME=C.UTF-8 LC_COLLATE=C.UTF-8
## [5] LC_MONETARY=C.UTF-8 LC_MESSAGES=C.UTF-8
## [7] LC_PAPER=C.UTF-8 LC_NAME=C.UTF-8
## [9] LC_ADDRESS=C.UTF-8 LC_TELEPHONE=C.UTF-8
## [11] LC_MEASUREMENT=C.UTF-8 LC_IDENTIFICATION=C.UTF-8
##
## attached base packages:
## [1] stats graphics grDevices utils datasets methods base
##
## other attached packages:
## [1] htmlwidgets_1.5.1 plotly_4.9.2.1 gdtools_0.2.2
## [4] cowplot_1.1.0 ggiraph_0.7.8 palmerpenguins_0.1.0
## [7] swirlify_0.5.3 igraph_1.2.5 sbm_0.2.1
## [10] reticulate_1.16 rkeops_1.4.1.1 optimLibR_0.1.0
## [13] slider_0.1.5 fable_0.2.1 fabletools_0.2.1
## [16] tsibble_0.9.2 vip_0.2.2 skimr_2.1.2
## [19] yardstick_0.0.7 workflows_0.1.3 tune_0.1.1
## [22] rsample_0.0.7 recipes_0.1.13 parsnip_0.1.3
## [25] modeldata_0.0.2 infer_0.5.3 dials_0.0.8
## [28] scales_1.1.1 broom_0.7.0 tidymodels_0.1.1
## [31] MASS_7.3-52 mgcv_1.8-33 nlme_3.1-149
## [34] fda_5.1.5.1 Matrix_1.2-18 deSolve_1.28
## [37] GGally_2.0.0 ggdist_2.2.0 distributional_0.2.0
## [40] DT_0.15 forcats_0.5.0 stringr_1.4.0
## [43] dplyr_1.0.2 purrr_0.3.4 readr_1.3.1
## [46] tidyr_1.1.2 tibble_3.0.3 ggplot2_3.3.2
## [49] tidyverse_1.3.0
##
## loaded via a namespace (and not attached):
## [1] utf8_1.1.4 diffeqr_1.0.0 tidyselect_1.1.0
## [4] grid_3.6.3 ranger_0.12.1 cpp11_0.2.1
## [7] pROC_1.16.2 munsell_0.5.0 codetools_0.2-16
## [10] future_1.18.0 withr_2.2.0 colorspace_1.4-1
## [13] progressr_0.6.0 highr_0.8 knitr_1.29
## [16] uuid_0.1-4 blockmodels_1.1.1 rstudioapi_0.11
## [19] readODS_1.7.0 listenv_0.8.0 labeling_0.3
## [22] repr_1.1.0 DiceDesign_1.8-1 farver_2.0.3
## [25] vctrs_0.3.4 generics_0.0.2 ipred_0.9-9
## [28] xfun_0.16 nycflights13_1.0.1 R6_2.4.1
## [31] RcppEigen_0.3.3.7.0 JuliaCall_0.17.1.9000 bitops_1.0-6
## [34] lhs_1.0.2 reshape_0.8.8 shinyAce_0.4.1
## [37] assertthat_0.2.1 promises_1.1.1 nnet_7.3-14
## [40] gtable_0.3.0 swirl_2.4.4 globals_0.12.5
## [43] timeDate_3043.102 rlang_0.4.7 systemfonts_0.3.1
## [46] splines_3.6.3 lazyeval_0.2.2 yaml_2.2.1
## [49] modelr_0.1.8 crosstalk_1.1.0.1 backports_1.1.9
## [52] httpuv_1.5.4 tools_3.6.3 lava_1.6.7
## [55] ellipsis_0.3.1 RColorBrewer_1.1-2 Rcpp_1.0.5
## [58] plyr_1.8.6 base64enc_0.1-3 RCurl_1.98-1.2
## [61] prettyunits_1.1.1 rpart_4.1-15 openssl_1.4.2
## [64] haven_2.3.1 fs_1.5.0 furrr_0.1.0
## [67] magrittr_1.5 data.table_1.12.8 warp_0.1.0
## [70] reprex_0.3.0 GPfit_1.0-8 whisker_0.4
## [73] hms_0.5.3 mime_0.9 evaluate_0.14
## [76] xtable_1.8-4 jpeg_0.1-8.1 readxl_1.3.1
## [79] gridExtra_2.3 testthat_2.3.2 compiler_3.6.3
## [82] crayon_1.3.4 htmltools_0.5.0.9000 later_1.1.0.1
## [85] lubridate_1.7.9 DBI_1.1.0 dbplyr_1.4.4
## [88] rappdirs_0.3.1 cli_2.0.2 parallel_3.6.3
## [91] gower_0.2.2 pkgconfig_2.0.3 xml2_1.3.2
## [94] foreach_1.5.0 hardhat_0.1.4 prodlim_2019.11.13
## [97] anytime_0.3.9 rvest_0.3.6 digest_0.6.25
## [100] rmarkdown_2.3 cellranger_1.1.0 shiny_1.5.0
## [103] lifecycle_0.2.0 aricode_1.0.0 jsonlite_1.7.1
## [106] viridisLite_0.3.0 askpass_1.1 fansi_0.4.1
## [109] pillar_1.4.6 lattice_0.20-41 fastmap_1.0.1
## [112] httr_1.4.2 survival_3.2-3 glue_1.4.2
## [115] png_0.1-7 iterators_1.0.12 class_7.3-17
## [118] stringi_1.4.6 blob_1.2.1